Reports Module
The Report section is a great tool for your managers and anyone who enjoys seeing your company’s progress in numbers. Statistics, reports, lists, and graphs shed light on the many sides of your business. Its main features are:
- Statistics for Sales, bookings, flights and more
- Reports on cosmic radiation, empty legs, and more
- Customizable tables, graphs, and lists
Screen Elements
See all the reports available in FL3XX, sorted by operational areas:

The users of the system can view different sections of the reports, depending on their access rights (e.g. a salesperson can only view the Sales and the Shared reports).
For more details about access rights, please refer to the Persons Module
Each of the reports can be customized, filtered based on persons, time frame, etc., and exported to PDF and CSV format.
You can also share to all users the reports generated when you select the "Share to all users" check box.

* Functionality and methods to generate reports shown below are applicable to every module.
1) Generating a report
- Click on one of the reports
- Choose the attributes you would like to see in the report, you can click "Add More" to see more hidden attributes

2) Sort Function
You can click the title bar to sort the content of a particular column.

3) Graphic Tables
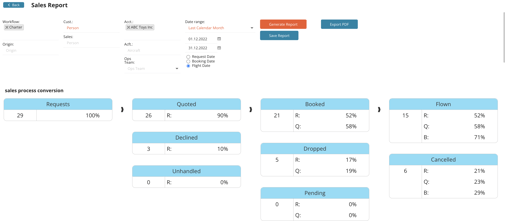
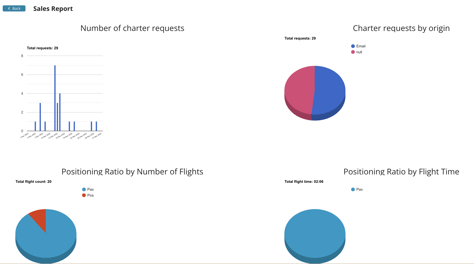
When you scroll down you will find the graphic tables. You can see more details by hovering your cursor over the bars. For example, here are graphs from the Sales report:
Sales Reports
Owner: statistics about block time, revenue, destinations, and occupancy
Sales: sales process conversion, reasons for lost sales, and other statistics related to customers and requests
Bookings: details of bookings, such as block hours, pax legs, ferry legs, etc
Bookings/ Fees: details of bookings, together with various costs
Empty Legs: This report lists all empty legs in the system, by clicking the checkbox on the left-hand side, these empty legs will be pushed to the marketplace(FL3XX's Integration Partners) of your choice. Write to support@fl3xx.com if you have questions in how to set it up.

Accounts: statistics related to the account, such as booked ratio, total booked hours, etc
Crew Reports
FTL Dashboard: To keep an eye on cumulative duty hours. In one screen you now see all cumulative block times, duty and rest limitations, and their current status. You find the dashboard under Report / FTL Dashboard.
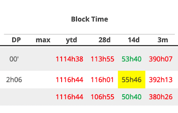
Duty Time Violation: You can easily export data for crew assigned to a specific Aircraft or AOC. Making it easier to get the overview e.g. in an audit scenario.
Roster Planning: You can download the Roster in a CSV. file. Select a date range or a custom period, download it for a certain member of your team, filter by Role, or export all.
Logging: The logging report gives you extra information on several key crew training elements such as landings and take-offs, actual block and flight times, approaches, type ratings, and more.
Expiring Licenses: The Crew Expiring Licenses Report is your all-in-one solution for managing and tracking license renewals within your team. Stay on top of expiring licenses, certifications, and qualifications, ensuring your crew remains compliant and ready for action. Simplify compliance management with this essential tool, now updated with the 'covered by' logic in Staff.
Assignments Report: This report offers an overview of all your crew assignments (Staff page) together with an (optional) visual indication of the good through if available (more details about good through in the Training Module article).
The “Staff Statistics” report (the one showing rows like Blocktime / OFF / Sick / Vacation) is not counting “calendar OFF dates”. It sums up the total time that is booked as roster duty type OFF (and also Sick / Vacation) and then converts that into “days” by dividing by 24 hours and rounding.
Maintenance Reports
Maintenance: This report shows you how many maintenance events were planned in a preferred maintenance location and/or in other locations; including the reason and the person who created it. It differentiates between scheduled and unscheduled maintenance. It shows the provider, the reason for selecting it, and costs (estimated and actual).
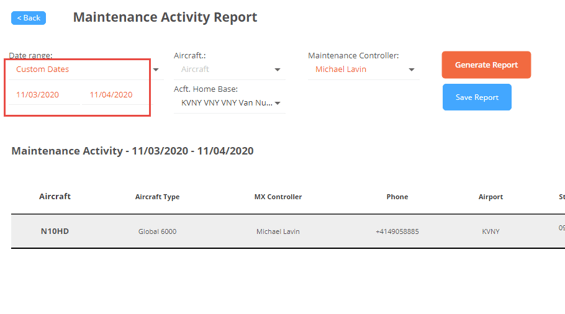
Maintenance Activity:
There are several date filters for the maintenance activity report.
-
The next 7 days show the ongoing events and any future event that STARTS in the timeframe
-
Next 30 days how the ongoing events and any future event that STARTS in the timeframe
-
Next 90 days how the ongoing events and any future event that STARTS in the timeframe
There is also an airport filter to the report, where users can search per Home Base airport and show the events of all aircraft based there.
Shared Reports
This category comprises reports generated by a single user within the company, complete with specific filters or specifications. You have the ability to craft a report with distinct attributes and store it in this section, enabling other company users to access and view it.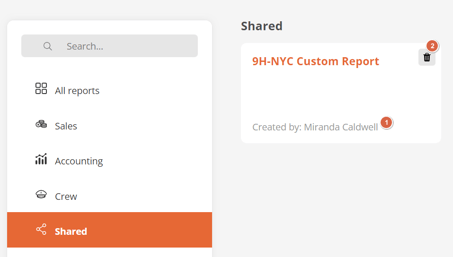
Within the Shared Reports section, you can readily identify the creator and owner of a report. Moreover, we offer the option to delete such reports, extending this capability beyond the original owner to any user.
Favorite Reports
Quick Access to Your Essential Reports
Save time finding your frequently used reports with the "Favorites" feature. Here's how it works:
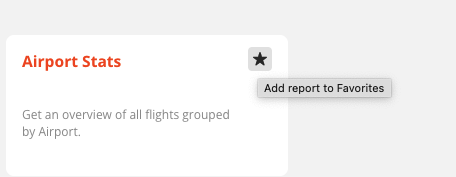
- Mark Your Favorites: Locate the star icon in the top-right corner of any report. Click it to add the report to your "Favorites".
- Instant Access: All your "Favorites" will automatically appear at the top of your reports page for easy access.
- Declutter Your List: No more scrolling through long lists to find the reports you need most!

Custom Reports
Create Personalized Reports for Faster Insights
Tired of setting up the same report filters every time? Save time and effort with custom reports! Here's how they work:
Your Reports, Your Way: Customize reports by selecting the exact filters and data fields that matter to you.
Time-Saving Shortcut: Your custom reports will remember your preferences. The next time you need them, they're ready to run with just a few clicks.
Streamline Analysis: Get straight to the insights you need without fussing with repetitive setup.
You can even share your custom made report to colleagues by using the 'share to all users' option.

Converting a CSV to excel
FL3XX uses the CSV format for reports as it is platform and version independent.

If you’ve exported a CSV file from FL3XX and need to open it in Excel, follow these steps:
-
Open Excel:
- Navigate to File > Import.
-
Select the CSV File:
- Choose the CSV file you want to convert and click Import.
-
Use the Text Import Wizard:
- In the wizard, select Delimited and click Next.
- Check the box for Comma as the delimiter and click Finish.
-
Choose a Worksheet:
- Decide whether to import the data into an existing worksheet or a new one.
Your CSV data is now ready to use in Excel!
Users with Administrator access rights inherently possess full control, including the ability to modify or delete the shared reports section by default.
If you desire modifications to extend control over shared reports, please reach out to our support@fl3xx.com.
